Welcome to the dynamic world of digital marketing, where content isn’t just king; it’s a vibrant, visual storyteller. In an era saturated with information, capturing and holding attention is a marketer’s ultimate challenge. While text-based content is crucial, it’s the visual elements that truly make a connection. People visualise 60,000 times quicker than they can read, and content with relevant pictures gets 94% more views than content with no pictures. That’s where infographics put on their super-suit and perform their incredible transformation from complex to digestible, shareable, and highly engaging.
Besides just being attractive, they also become the visitor’s gateway to your content, a source of your authority, and most importantly, a helper in the climb of your website rankings. This article dives deep into the art and science of infographic submission sites, revealing how these platforms can be your secret weapon for building high-quality backlinks, boosting visibility, and driving organic growth in 2025 and beyond.
What Are Infographics & Why They Work in 2025
Infographics are one of the most powerful tools when it comes to conveying complex information in a visually appealing way. Infographics are not merely vibrant pictures; they are data-driven narratives that attract the eyes and minds of users by simplifying complicated concepts very quickly and allowing them to recall them later. Over time, the power of blending different visual elements, such as charts, icons, and even minimalist text, has been proven to be highly effective in creating brand stories that even the casual viewer remembers.
Some of the key benefits that infographics have are as follows:
- Simplification of Complex Data: Infographics convert numbers and data into easily digestible visuals.
- Increased Engagement: One can’t attract the reader’s attention better than visual storytelling, and that’s precisely what it does.
- Increased Shareability: Infographics are shared 3 times more on social media than other types of content.
- SEO and Link-Building Potential: Platforms with infographics typically have backlinks from other sites, which allows search engines to easily index and rank them higher.
Infographics are really effective when it comes to educational content, industry reports, and marketing strategies. If skillfully done, they become both informative and credible for the brand simultaneously. Through data visualization, one instantly gets to know the combinations, comparisons, and statistics without having to read lengthy and tedious paragraphs of text.
How infographics work to boost marketing and SEO
- Drive backlinks: When other websites link to your infographic, you get high-quality, authoritative backlinks.
- Increase referral traffic: Visitors attracted by shared infographics are the ones who will find your content truly interesting and then share it further on.
- Improve user engagement: Sites with infographics tend to have lower bounce rates, and the time-on-page metrics are longer.
- Support brand authority: Just like a thought leader who is ready to show and not only say, giving data-driven, well-designed infographics is your brand stance alongside the top players of your field.
To sum it up, infographic submission sites in 2025 act as multi-functional assets. For brands that wish to stand out in this overpopulated digital landscape, creating and releasing high-quality infographics is not merely an option but an imperative.
How Search Engines View Visual Content & Backlinks in 2025
Digital marketing success in 2025 will go beyond mere content publishing. Google and other search engines are gradually embracing the concept of E-E-A-T (Experience, Expertise, Authoritativeness, and Trustworthiness), which means that visuals like infographics are becoming an increasingly important tool for the demonstration of a website’s or an author’s authority.
The factors that mainly influence how search engines establish the nature of the visual content and the number of backlinks are given below:
1. Produce High-Quality Visual Content
Expertise is shown to search engines through original and well-resourced visuals. For infographics to have a significant effect:
- Data must be accurate and relevant.
- Create visually attractive and easy-to-read layouts.
- Give citations and references to improve credibility.
- Do not allow too many elements in one graphic so that your viewer will not get confused.
Search engines will promote content that authoritatively portrays truth to users without expecting anything in return.
2. Build Strategic Backlinks
Backlinks are like voter support for your material. In 2025, quality will be bigger than quantity:
- Acquiring links from sites with high Domain Authority (DA) and reputable infographic submission platforms should be the main target.
- Stay away from low-quality or spam websites, which may lead to a drop in rankings.
- Ethical editorial links where a site voluntarily refers to your infographic have more power than automated or low-effort backlinks.
- Do not only depend on one source to get links, but at the same time, make sure that the source is related to your topic.
Strategic backlinks facilitate search engines in recognising your content as trustworthy and valuable.
3. Work on Context and Metadata
How the visual content is accessible also affects the search engines:
- All images must have descriptive alt texts.
- Captions and headings of visuals should include the targeted keywords.
- The content structure should enable search engines to determine the connection between each visual asset.
If properly worked on, visuals will not only be appealing to humans but can also be fully indexed and ranked by search engines.
A brand can use high-quality visual content along with strategic backlinking to dramatically increase its visibility on search engines. Shareable, trustworthy, and properly formatted infographics are a source of authority, referral traffic, and ranking. In 2025, these kinds of strategies will be the main digital marketers’ weapons to stay ahead in the competition.
How Infographic Submission Boosts SEO & Link Building
Infographic submission sites are a tool for off-page SEO that can considerably increase the level of your website’s effectiveness. The process is quite straightforward: you make a top-notch infographic and then publish it in various web directories and platforms. These points explain what the key can be for such a big SEO benefit:
1. Acquiring High-Quality Backlinks
The most significant advantage that comes with it is the possibility of making backlinks. By putting a backlink to your site either in the description or the embed code, you’re making a good backlink that informs search engines that your website is an authoritative source.
2. Driving Targeted Traffic
A well-done infographic submission to sites may attract a lot of visitors. People who go through infographic repositories are the ones who want visuals to understand a particular subject. If they find your infographic helpful, they will click on the source link, bring to your site the visitors qualified and engaged. The more traffic, the better for you, because this can send positive interaction signals to search engines as well.
3. Boosting Brand Visibility
When you constantly submit infographics, you expose yourself to more people apart from your existing followers. Infographics are highly shareable, and when they appear on social media, they can go viral, thus increasing brand awareness and building trust. Also, this steady presence across multiple infographic submission sites will help you become known as the thought leader in the industry.
4. Improving Social Signals & Engagement
The more platforms your infographic is shared on, the more social signals (likes, shares, comments) it generates for you. Though these signals are not the direct ranking factors, they can influence the rankings indirectly by showing that your content is valuable and engaging. Moreover, there are social sharing features built into many infographic submission sites that make it even easier for people to share your content.
Top High DA Infographic Submission Sites List 2025
Key SEO Metrics & Trust Signals When Choosing Infographic Submission Sites
Not all infographic submission sites have the same level of quality. To get the most SEO benefits out of your infographics, you must be very strategic about where you place your content. Find websites that demonstrate these key metrics and trust signals:
- High Domain Authority (DA): It is the most significant metric of all. A site power (30+) shows the site’s authority and its trustworthiness. A link from a site like this has a lot of power. The likes of Visual.ly and Infographic Journal are two quite trustworthy and reliable submission sites for infographics, to mention a few.
- Active & Engaged Community: A site with an engaged community means that your infographic will be seen, shared, and talked about, which is directly related to increased traffic and social signals. Look for the latest submissions and engagement metrics, e.g., likes and comments.
- Clearly Defined Submission Guidelines: Legitimate sites always have quality standards. They will provide detailed descriptions of the size, file type, and content quality, along with a proper process for submission. It demonstrates that they maintain high standards for the quality of their directory, which is also suitable for link building.
- Mobile Optimisation: In 2025, the site should be mobile-friendly. Make sure the infographic submission websites you pick are visually content-friendly on all devices because a big chunk of web traffic is from mobile.
Infographic Design Best Practices for Submission
The effectiveness of an infographic depends on its design. To be approved by the top-tier infographic submission sites and have a high-performance display, follow these guidelines:
- Storytelling: Your data visualisation should have a clear and logical progression. Start with a catchy headline, clearly display the facts, and then give a conclusion or an invitation to act.
- Visual can be Appealing: Use a harmonious colour scheme, crisp images, and a neat layout. The visual aspect should be easily manageable and visually pleasing.
- Data is Real and Cited: All data you present must be authentic and well-researched. Have a little quote or source spot at the bottom to make the fact more trusted.
- Sharing: Your graphic should be in a vertical format (e.g., 800 x 2000 pixels), as this is ideal for social networks and infographic submission sites.
- Use of your Trademark: Set up your logo, website, and social media icons within the infographic itself. This leads to brand awareness, and even if it is shared without a backlink, your identity is still reinforced.
How to Submit Infographics the Right Way: A Step-by-Step Checklist
Submitting an infographic is not merely uploading a file. The thoughtful approach is the key to your success. Make use of this checklist to make sure that you make the right choices when submitting.
1. Pay Attention to the Format of the Infographic File
Before you decide to actually undertake the uploading process, your infographic file should already be user-friendly and SEO-friendly.
- File Size: The ideal size for your graphic should not exceed 1MB. Large files can cause the webpage to load slowly, resulting in a negative user experience and a higher bounce rate. Use image resizing tools (such as TinyPNG or Short Pixel) to shrink the file size without losing image quality. Images that are quick to load are a must-have for websites that carry a lot of visual content.
- Alt Text: It is an essential SEO feature. If you are posting your infographic, do not forget to add a descriptive alt text. Alt text is a short, clear, and informative description of the image content. Since search engines cannot “see” pictures, this helps them understand what the infographic is about.
- Filename: A descriptive filename is a small yet very powerful signal for SEO. Rather than going for the normal name like image123.png, you should pick a descriptive filename that includes relevant keywords and reflects the infographic’s topic. For instance, digital-marketing-infographic-statistics.png is not only more detailed and informative but also makes it easier for search engines to index it.
2. Add Embed Code & Source Link
This phase is the keystone of your whole link-building strategy. With the help of an embed code, your infographic becomes shareable, and at the same time, you get the proper attribution you deserve.
- Create an Embed Code: An exclusive embed code offers a simple way for other bloggers and media representatives to place your infographics on their own websites. Numerous online instruments and add-ons can do the work of outputting this code for you. Usually, it comprises the image location URL, a heading, and the dimensions.
- The All-Important Source Link: The conversion of the source code should be the source link that gives the direct path back to the page on your website where your infographic is stored. This is the way to get a high-quality, DoFollow backlink.
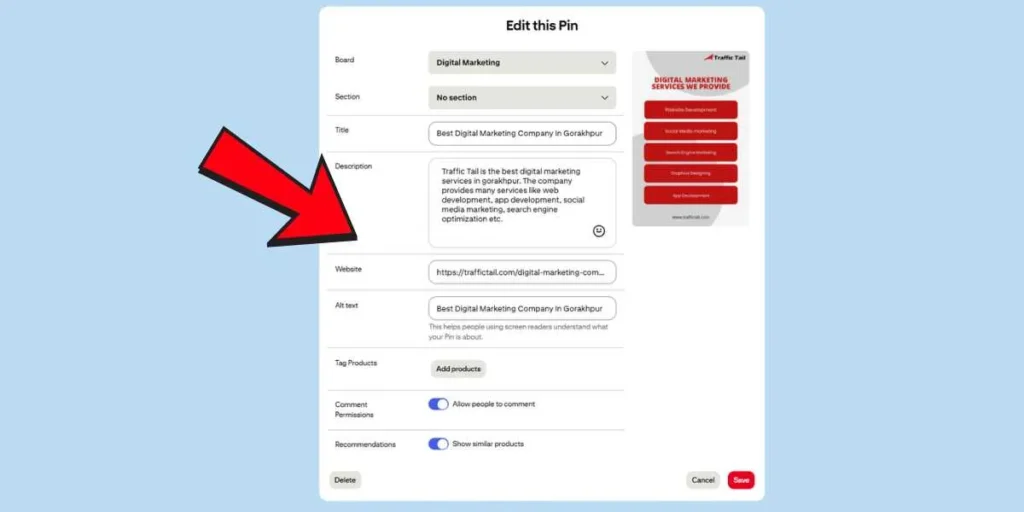
3. Craft a Keyword-Rich Title & Description
Just like any other piece of writing, your infographic has to have a catchy title and a compelling description if it is to draw attention to itself from both the search engines and regular users.
- Employ Your Primary Keyword: Your title has to be eye-catching and informative at the same time. For instance, your primary keyword, such as ‘infographic submission sites,’ should be included naturally. A perfect example of this could be: “The Ultimate Guide to Infographic Submission Sites for Link Building.”
- Use LSI Keywords: In the description, write a compelling summary of the infographic’s content. Naturally incorporate related or Latent Semantic Indexing (LSI) keywords. They are the related terms and phrases with the semantic field equal to the main one. For example, if the main keyword is “infographic submission,” the LSI keywords might be “infographic submission in SEO,” “free infographic sites,” “infographic directory,” and “infographic sharing platforms.” This helps search engines understand that your topic is in-depth and that you are an authoritative source.
4. Tag & Categorize Properly
Simply put, if you want your infographic to be seen by the right people, then submission sites need to be able to find it and organise it correctly.
- Use the Most Suitable Tags: Tags are like very small keyphrases that make it easier for a given platform to categorise your paper correctly. Use both general and very specific tags that are closely connected to the subject matter of the infographic. Suppose you had written a paper about digital marketing; you could select “data visualisation,” “SEO,” “marketing,” and “content strategy” as tags.
- Categories Help People Find Your Topic: Along with making sure you have the most suitable tags for your infographic on the submission sites, it is even more vital that you make sure that your infographic is put in the right section or sub-section on the infographic submission sites. This makes it easier for the right people to see your work because they will be the ones who are interested in your topic.
5. Include a Written Summary
Most infographic submission sites want a summary or an article to accompany the infographic. Make sure that you take this step and do not just pass it by.
The infographic on its own is a visual representation, but embedded or accompanying text can be “read” by web crawlers. A well-done summary means better indexing of the page by search engines as they come to understand the underlying message.
6. Promote After Submission
Once the infographic is accessible online, your work is not done. The final step is to actively promote it to achieve the maximum number of views and the best backlink potential.
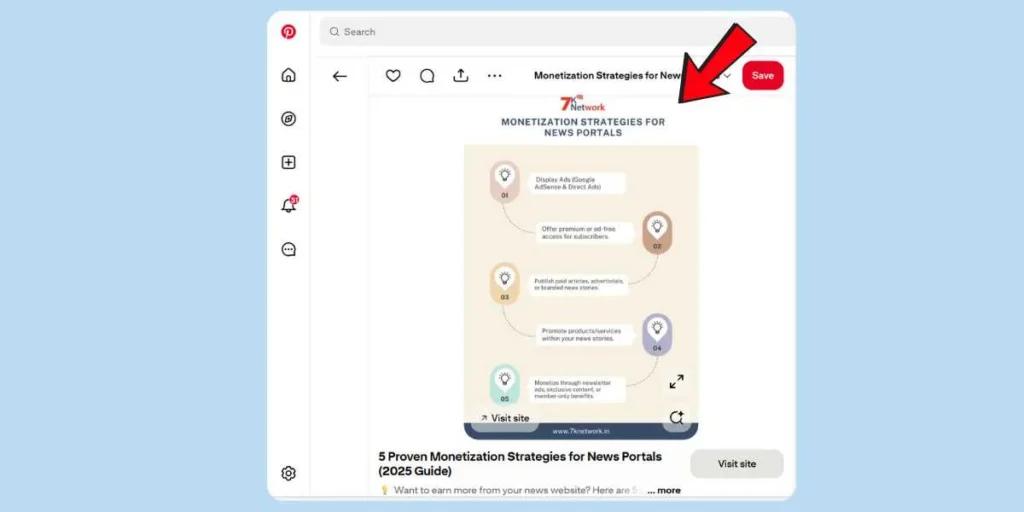
- Share on Social Media: Places for sharing, such as LinkedIn, Pinterest, and X (formerly Twitter), are good venues to post your live infographic and its link. To get more eyes on your post, implement or attach pertinent hashtags to it.
- Email Outreach: Propagate your infographic amongst bloggers, journalists, and industry influencers. They might find it relevant for their audience. A brief note highlighting the value of your infographic and offering it as a resource can be a source for a natural, authoritative, and influential link to emerge.
Risks & Mistakes to Avoid
Infographic submission, though effective, has its weaknesses. These include:
- Submitting to Spammy Sites: Stay away from submission websites of the lowest quality, with suspicious trustworthiness and a history of spam. Links from a bad neighbourhood can do the opposite of the intended effect of your SEO; that is, they may harm your website’s SEO instead of helping it.
- Duplicate Content: Even if you decide to upload the same infographic to various platforms, creating unique titles and descriptions for each shouldn’t be overlooked. Besides, it helps to steer clear of duplicated content that may result in a drop in your rankings.
- Poor Design & Data: Do not create or do not allow the creation and distribution of infographics with poor design or wrong facts. They have low chances of acceptance by reputable infographic submission sites, and if they happen to get published, it will definitely damage your brand’s reputation.
- No Source Link: Absence of the source URL or a working embed code means you are giving up on the primary benefit – the backlink.
Beyond Submission: Extra Off-Page SEO Strategies with Infographics
Infographic submission is not the only way to go. You can use your infographic for other powerful off-page SEO strategies. These include:
- Guest Blogging: Writing your guest post for the industry blog can be the avenue to disseminate your infographic as a visual aid to the post. This can be the door to obtaining a high-quality, contextual backlink of trust.
- Content Repurposing: Instead of sharing the complete infographic, it is possible to break it down into small pieces and use them for social media posts, blogs, or even a YouTube video. Every one of these can be a link back to the original infographic on your website.
- Outreach: Equip yourself with contacts of bloggers and journalists who are interested in not only the topic but also in your resourceful infographic. This strategy may not only lead to authentic backlinks but also mentions on high-quality platforms.
The Future of Infographic Submission in SEO
Key trends to watch for in infographic submission in SEO:
- AI-Powered Platforms: When using AI, the right audience will be identified for the content of the infographic sources.
- Emphasis on Quality: Data-backed, well-designed infographics will outperform generic visuals.
- Better Visibility: More accurate classification and tagging will increase the visibility of the infographics on the search engines and social media.
- Content Marketing Collaboration: The use of infographics will be extended to the blogs and articles as a whole content marketing plan.
- User Engagement Metrics: Clicks, shares, and interactions are the metrics that platforms will use to give a particular position to infographics.
One significant influence of infographic submission changes can be observed in the various techniques employed by marketers. Marketers should now give more priority to making the infographics informative, authoritative, and appealing.
Conclusion
Regardless of the new developments in SEO techniques, submitting infographics is still an essential part of the whole game. You may considerably increase online visibility through the use of reliable infographic submission sites, get valuable backlinks, and generate targeted traffic to your website.
You need to be diligent in your approach: Create quality content, format it properly, and be strategic as to where you submit your content. Infographics are a potent mixture of information and art, and if used correctly, they will be one of your most powerful SEO weapons. Therefore, create your next visual masterpiece and get started with this fabulous idea!
FAQs
How do I submit an infographic?
You submit an infographic by first creating a high-quality visual, then uploading it to a submission site, filling out a keyword-rich title and description, and including a source link back to your website.
What is the best infographic website?
“Best” here means the infographic website that is most suitable according to your goal; however, Visual.ly, Infographic Journal, and Behance are the leading ones from the standpoint of domain authority and the number of subscribers of their users.
Where do people post infographics?
Infographics are posted by submission sites, social media such as Pinterest and Reddit, and industry blogs through guest posts.
Can AI do infographics?
Yes, AI-driven tools like Canva, Venngage, and Piktochart are just a few names that come to mind when discussing the implementation of AI to create infographics quickly from data or text, thus making the entire design process much quicker and more accessible.
How do I insert infographics?
By simply uploading the image file and then embedding it using HTML code, which typically includes a direct link to your source page, you can easily attach an infographic to your website.