

This never-ending search for a perfect data solution is rather like a journey in pursuit of the Holy Grail, isn’t it? Microsoft has long been sitting at the top of the landscape; however, in 2026, a brand new generation of agile Power BI rivals entered the game. In truth, industry trends at this moment reveal that close to 35% of midsized businesses today are now setting out into new realms in search of tools with greater pliability beyond or in addition to Microsoft’s offerings.
Whether you are tired of DAX formula complexities or are just looking for a tool that is more than an Excel add-on, you are not alone. Businesses everywhere are discovering that a famous tool is not automatically and invariably the ultimate solution.
In this article, we will walk you through the top Power BI alternatives that might be your next favorite data partner. Read on!
What Power BI is and Why It’s Not for Everyone
Power BI is a big gun in the analytical space that can take ugly data and make it pretty, but it’s not free either. Although it’s beneficial for people deeply invested in the Microsoft ecosystem, for most people, it’s actually too clunky for today’s fast-paced workflow. Here are some reasons why it is not for everyone:
- Ecosystem lock-in: It’s optimized for Windows and Azure, and this can be very confining on Mac computers.
- Complex DAX: The process of creating complex formulas may be accompanied by a high learning curve that may appear as though one has to learn an altogether different language.
- Performance Lag: While working on large databases, there may be instances of delay in the user interface, making it inconvenient to use.
- Mobile Limits: The mobile interface works adequately, but it does not have the “on the go” capabilities that new Power BI solutions offer.
- Price Creep: What begins as a low-cost license at $10 could skyrocket as you purchase more licenses and advanced features.
Why Active Searches for Power BI Alternatives Occur
The Microsoft departure isn’t a simple trend; it’s a planned changeover for those who long for more flexibility in their work. Here are the primary reasons why companies are leaving Microsoft for other Power BI alternatives:
- Cloud Flexibility: Today’s teams expect scalable technology to work well together with Snowflake, BigQuery, and AWS with no hassle.
- Natural Language: The users should type “What were the sales in May? ”and get the data instantly without generating any report.
- Mac Support: A large number of design and tech professionals are Mac users, requiring them to rely on native high-performance apps on these computers.
- Transparency when it comes to pricing: No one enjoys being surprised by surprise costs, so it’s best to keep it simple, such as flat fees or costs per user.
- Embedded Needs: The need to embed charts into companies’ apps seamlessly is a requirement that is easily met by a Power BI alternative.
How I Assessed these Power BI Alternatives
In order to provide you with this list, I dug beyond the hype and examined what truly matters to you when you are in the trenches of data analysis. The factors I considered to rank these alternatives to Power BI include:
- User Experience: A part of my analysis involved determining the level of ease in creating a dashboard from scratch as a non-technological individual.
- Data Speed: We tested the speed at which these tools can process millions of rows without causing your browser to crash.
- AI Integration: I made an attempt to understand the effectiveness of the “AI” functionality available and observed the extent to which it provides intelligent search and insights.
- Cross-Platform: It was imperative to evaluate the capabilities of these tools when working with various operating systems as well as other mobile devices.
- Community Support: A tool will only be as good as the support system you can rely upon when you’re stumped at 2 PM Tuesday.
Top 10 Power BI Alternatives in 2026
1. ThoughtSpot
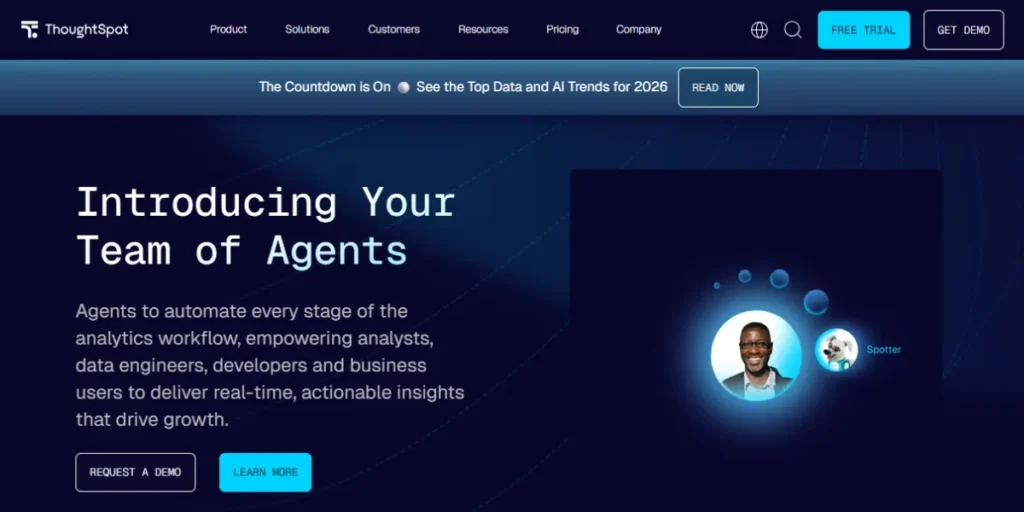
ThoughtSpot is an industry leader for search-enabled analytics, and it certainly makes it to this list for the most novel Power BI alternatives available on the market right now. You do not require any clicking and dragging of boxes since all you need is to enter your questions naturally, and all the visuals will be presented instantly right before your very eyes.
Moreover, its “Spotter” AI feature works like an intelligent personal data assistant with an innate ability to grasp the subject, intent, and context. Furthermore, it processes an enormous amount of data at breakneck load speeds, such that you will not be stuck due to the finish time of the load tasks.
Key Features:
- Natural Language Search: Ask your search queries in natural language, like English, to produce instant charts.
- Spotter AI: An AI assistant that uses intent analysis and offers a contextual perspective.
- Liveboards: These are interactive dashboards that dynamically update in real time as the underlying data changes.
- Mobile-First Design: Full-featured mobile application enabling data exploration on the move.
- Pin Boards: Enables users to quickly “pin” and organize particular insights for easy access.
Pros:
- Speed: Extremely quick execution speed, even when dealing with billions of rows of data.
- Not SQL: Enables users without technical knowledge to discover answers themselves.
- Cloud Native: It provides smooth integration capabilities with the latest versions of data warehouses such as Snowflake and BigQuery.
Cons:
- Complex Setup: The first step of data modeling might be complex and time-consuming.
- Price: Primarily designed for enterprise-level budgets; has a steeper entry price.
- Formatting: Not intended to produce “pixel perfect” paginated reports suitable for printing.
- Technical Onboarding: The administrators still require good data engineering skills to implement it.
Pricing: Starting as low as. $50 per user / per month (billed annually).
Best For: Teams that want search-based, AI-powered insights without technical hurdles.
Website Link: https://www.thoughtspot.com/
2. Tableau
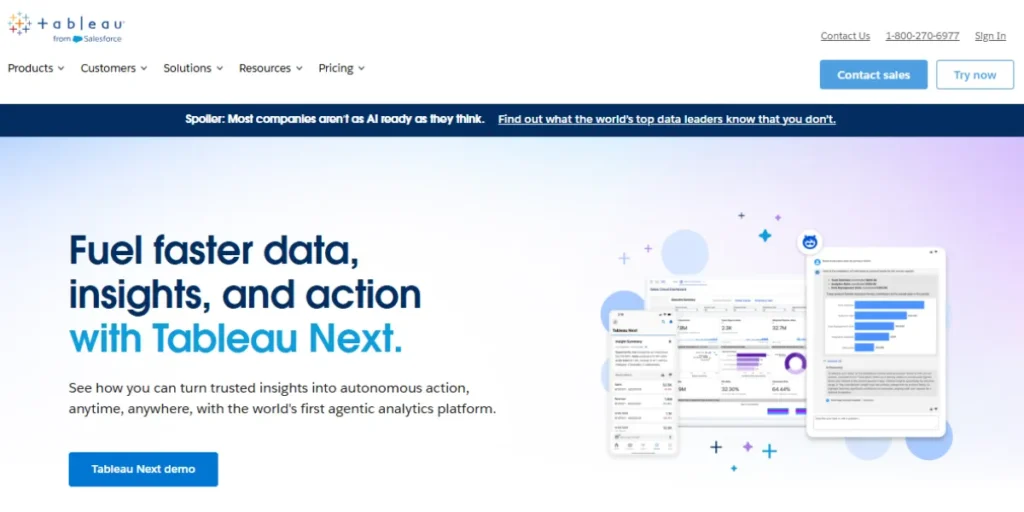
Tableau is often cited as the gold standard for beautiful, deep data storytelling and remains a top-tier choice. The detail of visualization that Tableau provides isn’t possible with any other application on the market. In addition, the user base is enormous, so there’s bound to be a template or a tutorial out there for whatever problem you’re trying to solve.
Moreover, there are strong predictive analytics tools to help forecast where trends are headed. The drag-and-drop functionality also works well once you learn the ropes, but the cost can become prohibitively expensive for smaller organizations to support.
Key Features:
- VizQL Technology: This is responsible for converting drag-and-drop operations into data queries.
- Tableau Prep: It is a tool meant for preparing messy data.
- Advanced Mapping: Industry-leading geospatial analysis and custom map layers.
- Hyper Engine: An in-memory data engine that is optimized for quick processing of large data extracts.
- Comprehensive Connector Library: Connectivity can be established with any data source.
Pros:
- Visual Excellence: Provides the most beautiful and personalized graphs in the BI industry.
- Massive Community: There is a huge community with thousands of templates as well as tutorials on the web.
- Robust Blending: Well-suited for blending different datasets into a united view.
- Complex Logic: Supports complex computations and parameters that would puzzle other software.
Cons:
- High License Cost: The individual “Creator” licenses cost much more compared to Power BI.
- Steep Learning Curve: When it comes to mastering complex functionality, it requires months of practice.
- Resource Intensive: Desktop apps tend to be resource-intensive when it comes to computer RAM.
- Stagnant Cloud Features: Certain users have noticed that the web editing interface is not up to par with the desktop application.
Pricing: Standard Edition: Viewer: $15 per user/month, billed annually. Explorer: $42 per user/month, billed annually. Creator: $75 per user/month, billed annually.
Best For: Data scientists and analysts who require high-end customized visualizations.
Website Link: https://www.tableau.com/
3. Looker (Google Cloud)
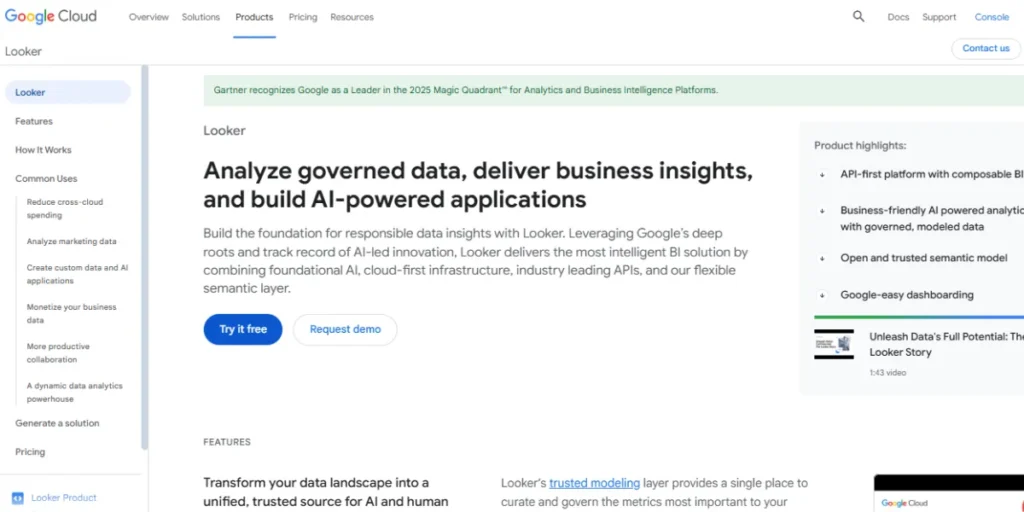
What differentiates Looker among the Power BI alternatives is the presence of a data modeling hub called LookML, which helps ensure that the whole business has standard definitions for things such as “revenue” and “churn.” Additionally, having a presence in the Google Cloud stack makes it refreshingly easy for those who have already purchased a BigQuery account.
It also has a fully web-native interface, meaning that there is nothing to install in order for everything to work on your computer. However, having someone with direct SQL experience will be required to establish your foundational model.
Key Features:
- LookML Modeling: A special code-based layer for defining metrics once and using them everywhere.
- Git Integration: Facilitates the version control of data models, just like in the case of software.
- Embedded Analytics: Seamlessly integrate Looker visualizations into your custom third-party applications.
- Google Cloud Native: Highly integrated with GCP services, particularly BigQuery.
- Custom Actions: Trigger workflows in other apps (like Slack or Marketo) right from your chart.
Pros:
- Consistency: It prevents different departments in the organization from providing different definitions for “Revenue.”
- Scalability: Designed with a cloud-native architecture capable of supporting huge scale.
- Collaboration: 100% browser-based, so it’s simple to share links and work collaboratively.
- Developer Friendly: High degree of control for teams that prefer coding over clicking.
Cons:
- SQL Knowledge Requirements: Setting up a LookML project requires SQL knowledge as a prerequisite.
- No Offline Mode: This application is web-based; hence, there is no way to operate offline.
- Initial Friction: It will take you longer to generate the initial chart compared to tools that are classified as “plug and play.”
- Cost: Enterprise software may be costly to obtain and use.
Pricing: Free Looker Studio for basic use and a paid Looker Studio Pro ($9/user/month) for more features, while the complete Looker platform (Now Looker in Google Cloud) starts higher, often $35k+/year
Best For: Tech companies that are growing quickly and require the same set of metrics for every department.
Website Link: https://cloud.google.com/looker
4. Zoho Analytics
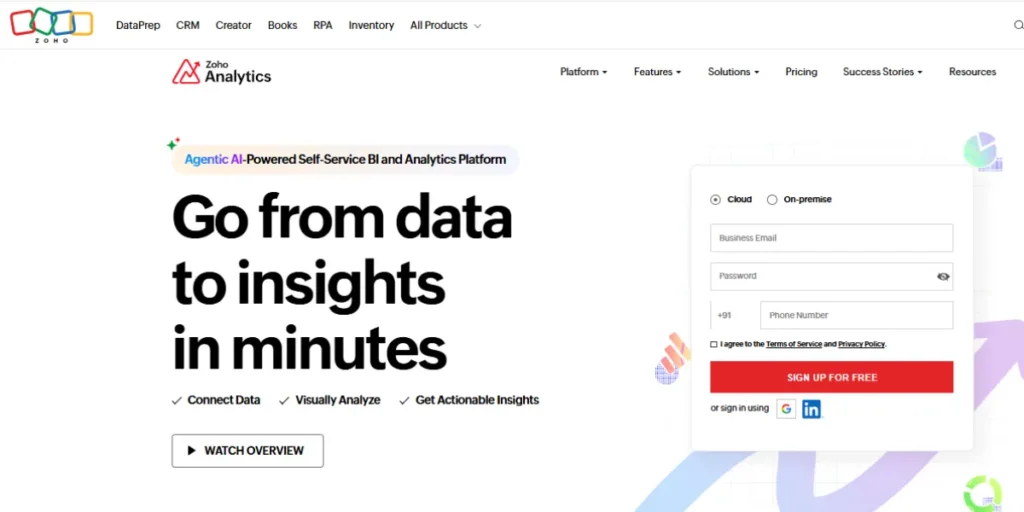
If you’re looking for a cost-effective and user-friendly entry point into business intelligence, Zoho Analytics is a great choice. It’s meant to be easy to use and comes with a super familiar drag-and-drop interface that’s a joy to work with. Moreover, it has hundreds of other apps that it can integrate with, such as Salesforce or even other Zoho apps.
Additionally, it has a super intelligent AI assistant called Zia that can assist you in creating reports. Not to mention that it’s even more affordable than other Power BI alternatives on the market. However, it may not have as many enterprise-level capabilities as others.
Key Features:
- Zia AI Assistant: An AI which can create reports based on voice or text instructions.
- Drag and Drop Builder: A very intuitive dashboard builder system.
- 250+ Connectors: Ready-built pipes for Salesforce, HubSpot, and Google Ads.
- White labeling: This allows you to use the tool to display data to your clients while giving it a name that suits your business.
- Feed-based Collaboration: Discuss reports in a social-media style comment thread.
Pros:
- Value for Money: One of the most affordable tools on this list.
- Easy Learning Curve: It takes new users only a few minutes to start building their dashboard.
- Fast Implementation: Little technical infrastructure is needed for typical data sources.
- Strong Mobile App: A highly rated mobile app available for viewing and engaging with reports.
Cons:
- Customization Limits: Difficulty with very complex or non-standard chart types.
- Performance: It may slow down when working with very large datasets that contain millions of rows.
- Ecosystem Lock-in: It works well if you are already using the Zoho ecosystem of apps.
- Support: Sometimes, advanced technical support takes time to respond.
Pricing: Basic at ~$12/month (2 users, 0.5M rows), Standard at ~$23/month (5 users, 1M rows), Premium at ~$51/month (15 users, 5M rows), plus a Free Plan with two users, 10K rows, five workspaces, and unlimited reports & dashboards (local taxes extra).
Best For: Small to mid-sized businesses seeking a simple and affordable BI solution.
Website Link: https://www.zoho.com/analytics/
5. Sisense
Sisense is intended for users who have to integrate their data right into their products or work with dirty, non-standard datasets. It comes with a patented “In-Chip” technology that enhances processing speed immensely. It is also highly customizable to enable programmers to design very targeted data experiences for their users.
Moreover, it provides options for both code and no-code solutions, which allows it to serve both analysts and engineers. In addition, it is also very good at combining big datasets across various regions without using a separate ETL solution. It is, however, quite an expensive investment.
Key Features:
- In-Chip Technology: This is patented technology that is used in processing information in the CPU cache in order to obtain high speeds.
- Elasticube: High-performance analytics database that caches big volumes of data.
- AI-Driven Insights: It automatically detects anomalies or trends present within the data.
- Hybrid Cloud Support: Supports operations in the cloud, within an organization’s premises, or a combination of both.
- Embedded SDK: Comprehensive support for developers to embed analytics into their apps.
Pros:
- Big Data Power: Excels at joining multiple large tables without crashing.
- Embedding Leader: A popular embedding solution for SaaS firms adding analytics tabs to their offerings.
- Flexibility: It appeals to “low-code” analysts and “pro-code” engineers.
- No ETL Separation: Typically wipes out the need for an ETL software solution.
Cons:
- Very Expensive: It is common for entry-level models to be priced too high for the average start-up.
- Technical Complexity: Needs a separate admin or engineer for proper functionality.
- UI Refresh: Certain aspects of the UI look a bit older than ThoughtSpot’s.
- Learning Curve: The management of “Elasticubes” needs certain training.
Pricing: Entry-level starts around $10k-$25k/year, with mid-market packages around $40k-$69k, and enterprise plans easily exceeding $100k annually
Best For: Product teams and developers who want to build data into their own software.
Website Link: https://www.sisense.com/
6. Qlik Sense
Qlik Sense has an “associative engine” that is uniquely capable of exploring how multiple points of information are relevant in ways that may not come up with traditional query tools. Rather than take the typical straight course, they allow you to pick any point on the chart and watch everything else light up or dim on the screen.
In addition, they not only promote self-service, but they also make it easy for the user to come up with their own solutions, making them strong Power BI Alternatives for modern data teams. Moreover, their mobile application is undoubtedly the top-rated available, with full functionality available on the go.
Key Features:
- Associative Engine: Automatically highlights similar data in white and irrelevant data in gray.
- Insight Advisor: An AI that recommends the most appropriate visualizations for your data.
- Multi-Cloud Support: Easily deploy across multiple clouds using a centralized interface.
- Dynamic Alerting: This alerts your phone when a KPI crosses a certain threshold.
- Data Governance: Effective tools for managing access to view and edit certain data.
Pros:
- Data Discovery: Extremely useful when searching for what can be considered “hidden” data that isn’t retrieved with a query.
- Interactive UI: Each graph is inherently related to every other graph shown on the screen.
- Offline Features: One of the very few modern applications that support offline mobiles.
- Scalable Security: Proven track record with highly regulated enterprise customers.
Cons:
- Complexity of Licensing: It may be confusing to understand their cost structures.
- Logic Shift: Those familiar with SQL query logic or Microsoft Excel query logic may find the associative logic in MongoDB a bit perplexing at first.
- Development Time: Creating complex data models in Qlik is a specialized skill.
- Resource Heavy: Heavy apps will consume large server resources.
Pricing: Starter at $200/month (10 users, 25 GB data), Standard at $825/month (25 GB data with scalable add-ons), Premium at $2,750/month (50 GB data with advanced AI & analytics), and Enterprise plans starting at 250 GB with custom pricing available on request.
Best For: Teams analyzing large sets of data and trying to reveal complex relationships among them.
Website Link: https://www.qlik.com/us/products/qlik-sense
7. Domo
Domo is a cloud-native platform that emphasizes speed and real-time communication. This platform is to be utilized from the CEO to the marketing intern, and it offers a rather social media-like experience to the interface. Moreover, it comes equipped with more than 1,000 pre-built connectors so that you can connect your data sources within minutes.
Additionally, it enables real-time chat functionality and collaboration directly on the charts. Also, it is one of the fastest Power BI alternatives if you have data spread across various sources everywhere. However, it is a rather pricey option compared to other alternatives.
Key Features:
- 1,000+ Connectors: The biggest pool of ready-to-use data connections in the market.
- Buzz: A chat and collaboration service that is incorporated in the dashboards.
- Magic ETL: A graphical “drag-and-drop” solution for data transformations and cleaning.
- Beast Mode: An easy-to-use calculation engine for building new metrics.
- Real-Time Dashboards: Designed for low latency viewing of “live” data.
Pros:
- Speed to Insight: You can go from raw data to a dashboard faster than most other companies.
- Pretty Design: Dashboards are professional-looking and executive-ready by default.
- Unified Platform: It is capable of managing the entire process of data ingestion, cleansing, and visualization.
- Executive Focus: Intended to be clearly accessible to non-technical management.
Cons:
- Premium Pricing: Amongst the most expensive BI solution offerings per user.
- Cloud Only: This type of hosting is not ideal for businesses that need their data to remain strictly on their premises.
- Vendor Lock-in: Once you create your data logic inside of Domo, it is very hard to move it out.
Pricing: Starting from $20k-$50k annually for small setups to $100k+ for enterprise, often hitting $100k-$200k+ for large companies
Best For: C-level executives who require immediate insight into high-level data.
Website Link: https://www.domo.com/
8. GoodData
The key area of focus for GoodData revolves around “Analytics as a Service,” making it a force to be reckoned with in organizations that supply data services to their own clients and positioning it among the leading Power BI Alternatives.
Power BI Alternatives. The product is extremely developer-friendly and supports “Analytics-as-Code,” letting you manage your dashboards in a software-like manner. In addition, this product supports a vast number of users with ease and requires no sweat at all. Also, its interface is extremely clean and modern, and is perfect regardless of which device one is using. It even integrates smoothly with GEO Tools, enhancing spatial analytics and location-based insights.
Key Features:
- Headless BI: This approach separates the data logic from its visualization for utmost flexibility.
- Analytics-as-Code: Using Python or Declarative Code for Your Full BI Infrastructure.
- Multi-tenant Architecture: Serve thousands of different clients with different data in one configuration.
- Open API: Enables full customization and implementation with existing portal platforms.
- React Components: These are prefabricated components for building the UI.
Pros:
- Infinite Scalability: Designed for a big distribution (for B2B scenarios).
- Modern Workflow: Fully integrates with a modern software development cycle (CI/CD).
- Clean Aesthetic: Modern and minimalist design that will look fantastic on any display.
- Cost Efficiency: Scalable and predictable broadcast fees based on high viewing volumes.
Cons:
- Developer Heavy: Not a “self-service” tool for the average office worker.
- Implementation Time: Takes a lot of engineering hours before it can be successfully implemented.
- Documentation: Advanced developer docs are described as complicated by some users.
Pricing: Startup – $30 per user/month; Professional – $30 per user/month + $1,500/month platform fee; Custom – Enterprise pricing via quote.
Best For: B2B firms requiring data to be transferred to their customers in volume.
Website Link: https://www.gooddata.com/
9. MicroStrategy
MicroStrategy, among Power BI alternatives, is an enterprise-level behemoth that has been around for a very long time and has always kept its solutions very up-to-date. They are renowned for their “HyperIntelligence” capabilities, whereby they embed the insights from the data directly into your browser/email client without needing to look at an analytics dashboard at all.
Also, they provide the most robust security/governance capabilities available. Moreover, they are very scalable for huge enterprises across the globe. In addition, their mobile products are very refined and are already being used by several Fortune 500 firms.
Key Features:
- HyperIntelligence: Hover over a name in your email or browser to see a data “card” about them.
- Federated Analytics: It enables people to work with other tools (such as Excel) while working with data in MicroStrategy.
- Enterprise Security: Military-grade governance and permissioning.
- Mobile Productivity: Custom apps enabling users to take any action (approving a budget) within the report itself.
Pros:
- Massive Scale: Deals with the largest data sizes of any tool in this list.
- Zero-Click Insights: HyperIntelligence is a one-of-a-kind capability that is unmatched in any other solution.
- Governed Data: This is best suited to large banks or government institutions with governed data and a need to comply with a regulation.
- Mobile Maturity: One of the most refined mobile offerings for the enterprise.
Cons:
- Complexity: It is an enormous effort to implement a Metadata layer.
- High Maintenance: It requires a team of professionals to maintain the system.
- Cost: Very high entry cost and maintenance charges.
- Old School: Some areas of admin design still seem outdated despite versions.
Pricing: Pricing starts at $13/mo/user.
Best for: Large companies with intense security requirements and massive amounts of data.
Website URL: https://www.strategysoftware.com/
10. Amazon QuickSight
QuickSight is one of the good choices for Power BI alternatives that are deeply integrated into the AWS environment and are also very cost-effective. It is a serverless business intelligence solution, which means you do not need to provision any server to make it functional. Additionally, it has a “Pay-per-Session” charging system that could yield significant cost savings when users occasionally view reports.
Further, it has a feature called “Q,” which is an AI-powered search engine that provides instant questions about your data. Also, it is fully integrated with S3, Redshift, and Athena. However, its reporting capabilities lack a little compared to Tableau.
Key Features:
- SPICE Engine: An extremely fast parallel calculation engine that runs in memory.
- Amazon Q: An engine that provides users with the capability to inquire and summarize dashboards.
- Pay per Session: Charge only when viewers visit a dashboard.
- ML Insights: Machine learning functionality for anomaly detection and forecasting.
- AWS Native: Deeply integrated with the AWS ecosystem.
Pros:
- Ultra Low Cost: The pay-per-session concept could save people thousands of dollars.
- Serverless: There are no servers to run, scale, or update; Amazon takes care of everything.
- Global Reach: Easily deployable in various regions around the globe in one click.
- Security: All the security certifications of AWS are inherited here.
Cons:
- AWS Reliance: Generally not a good option if your data is being hosted within Azure or Google Cloud.
- Feature Gap: Lacking some of the more advanced analytics capabilities of more mature products.
- Basic formatting: This is adequate in-house but perhaps too simple for high-end client pages.
Pricing: Authors typically pay around $24/month, and readers generally pay around $3/month (or $0.30/session in Standard Edition), plus SPICE storage costs ($0.38/GB/month) and optional Amazon Q features adding to the total cost.
Best For: AWS customers seeking an economical solution.
Website Link: https://aws.amazon.com/quicksuite/quicksight/
Comparison Table Between Different Power BI Alternatives
| Tool Name | Free Tier? | Open Source? | Mac/Linux Support | Python Friendly? | Best For |
| ThoughtSpot | Trial Only | No | Yes (Web) | Yes | AI-Search & Speed |
| Tableau | Trial Only | No | Yes (Native) | Yes | Visual Storytelling |
| Looker | No (Free Studio) | No | Yes (Web) | Yes | Unified Data Models |
| Zoho Analytics | Yes | No | Yes (Web) | No | Small Businesses |
| Sisense | Trial Only | No | Yes (Web) | Yes | Embedded Analytics |
| Qlik Sense | Trial Only | No | Yes (Web) | Yes | Interactive Discovery |
| Domo | Yes | No | Yes (Web) | No | Real-time Dashboards |
| GoodData | Yes | No | Yes (Web) | Yes | Developer-Led BI |
| MicroStrategy | Trial Only | No | Yes (Web) | Yes | Enterprise Security |
| Amazon QuickSight | Trial Only | No | Yes (Web) | Yes | AWS Integration |
What is Choosing a Proper Power BI Alternative?
Picking from the many Power BI alternatives available doesn’t have to be a coin toss if you follow a logical path. You should evaluate your needs based on your team’s skills and your current budget, as follows:
- Assess Skills: Do your skills involve clicking lots of buttons, such as in Zoho, or writing code, such as in Looker?
- Check Stack: Make sure it seamlessly integrates with your database without using any middleware software.
- Trial Period: It is essential to always use a 14-day or 30-day trial period with your actual data to check whether it lags.
- Mobile Needs: If your staff is always on the road, your needs will revolve around tools such as Qlik or ThoughtSpot.
- Scalability Check: Check the “per-user” cost for 50 users to ensure that you won’t go broke down the road.
Conclusion
Leaving behind a name brand is a big move, but it ultimately results in a more nimble, empowered, and happy data team. Choosing the right Power BI Alternatives can help ensure products work better with how teams operate, leading to more usage and making data insights more actionable. Consider whether you can use the artificial intelligence-driven searching functions available within ThoughtSpot software or if you’d simply prefer the look-and-feel interface available within Tableau software; you can easily eliminate friction within the day-to-day analytics process.
In the end, it is clear that the choice of a Power BI alternative has a direct correlation with how successfully a team is able to interact with data and whether or not analytics become an integral part of decision-making processes.
FAQs
What is the top free Power BI alternative?
Looker Studio (previously Google Data Studio) is the most widely used free tool for basic reporting needs, and Zoho Analytics has a generous free plan for small projects.
Are there better alternatives for a Mac user?
Yes, all of these tools mentioned above are either web-based or are available for Mac, making it easier for Apple computer users than Power BI.
Are these tools usable with Python programming?
Almost all professional-level Power BI alternatives, such as Tableau, ThoughtSpot, and Sisense, support Python script running to enable advanced data science.
What is the most appropriate tool for dealing with massive data sets?
ThoughtSpot and Sisense are specifically engineered to handle billions of rows with high speed, making them great for big data.
If I change tools, will my data be lost?
No, your data remains stored on your side (in your Snowflake or SQL database); you’re only shifting the “lens” through which you view data.